Old Segment
Profit and loss by segment
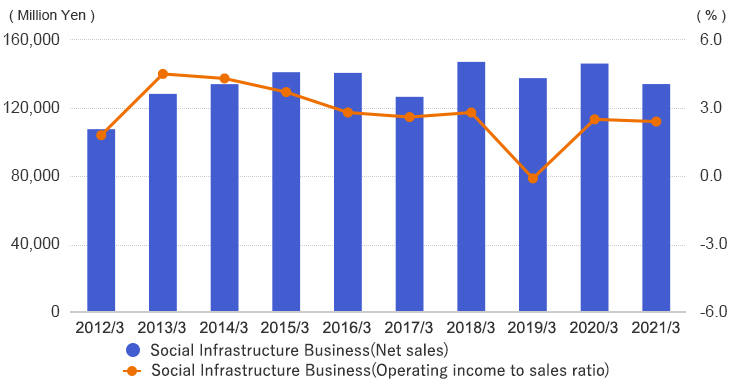
Social Infrastructure Business

| 2012/3 | 2013/3 | 2014/3 | 2015/3 | 2016/3 | 2017/3 | 2018/3 | 2019/3 | 2020/3 | 2021/3 | |
|---|---|---|---|---|---|---|---|---|---|---|
| Social Infrastructure Business(Net sales)(Million Yen) | 107,525 | 128,277 | 134,007 | 141,014 | 140,585 | 126,530 | 147,049 | 137,532 | 146,074 | 134,041 |
| Social Infrastructure Business(Operating income)(Million Yen) | 1,979 | 5,798 | 5,755 | 5,243 | 3,971 | 3,297 | 4,080 | -107 | 3,654 | 3,177 |
| Social Infrastructure Business(Operating income to sales ratio)(%) | 1.8 | 4.5 | 4.3 | 3.7 | 2.8 | 2.6 | 2.8 | -0.1 | 2.5 | 2.4 |
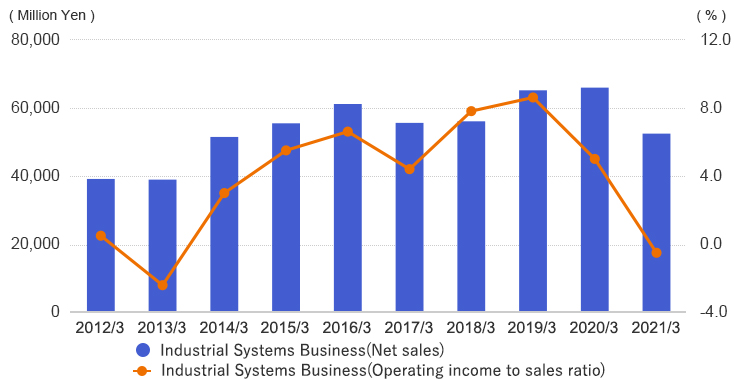
Industrial Systems Business

| 2012/3 | 2013/3 | 2014/3 | 2015/3 | 2016/3 | 2017/3 | 2018/3 | 2019/3 | 2020/3 | 2021/3 | |
|---|---|---|---|---|---|---|---|---|---|---|
| Industrial Systems Business(Net sales)(Million Yen) | 39,120 | 38,933 | 51,440 | 55,414 | 61,090 | 55,552 | 56,000 | 65,100 | 65,885 | 52,401 |
| Industrial Systems Business(Operating income)(Million Yen) | 186 | -929 | 1,557 | 3,023 | 4,030 | 2,465 | 4,384 | 5,622 | 3,272 | -286 |
| Industrial Systems Business(Operating income to sales ratio)(%) | 0.5 | -2.4 | 3 | 5.5 | 6.6 | 4.4 | 7.8 | 8.6 | 5 | -0.5 |
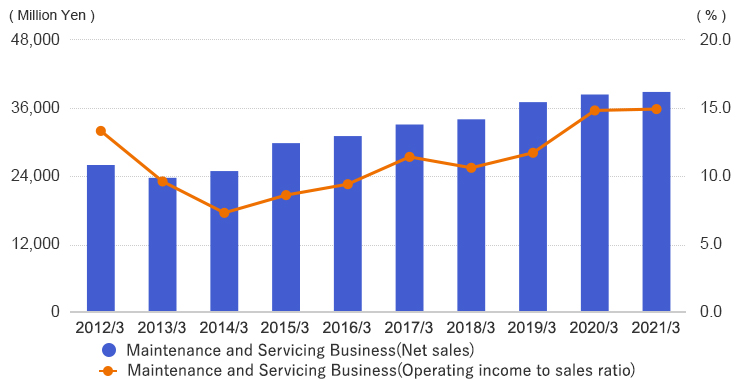
Maintenance & Servicing Business

| 2012/3 | 2013/3 | 2014/3 | 2015/3 | 2016/3 | 2017/3 | 2018/3 | 2019/3 | 2020/3 | 2021/3 | |
|---|---|---|---|---|---|---|---|---|---|---|
| Maintenance and Servicing Business(Net sales)(Million Yen) | 25,925 | 23,675 | 24,860 | 29,773 | 31,007 | 33,044 | 33,962 | 36,974 | 38,324 | 38,766 |
| Maintenance and Servicing Business(Operating income)(Million Yen) | 3,460 | 2,281 | 1,813 | 2,550 | 2,921 | 3,781 | 3,587 | 4,343 | 5,688 | 5,778 |
| Maintenance and Servicing Business(Operating income to sales ratio)(%) | 13.3 | 9.6 | 7.3 | 8.6 | 9.4 | 11.4 | 10.6 | 11.7 | 14.8 | 14.9 |

